What is the DataSet object?
The DataSet object is a data container designed to automate statistical, machine learning,
and manifold learning tasks including, but not limited to:
Data pre-processing, e.g., batch correction, normalization, imputation
Statistical summarization of data and associated metadata
Data visualization, e.g., Principal Component Analysis (PCA), Multi-dimensional Scaling (MDS), Uniform Manifold Projection and Approximation (UMAP)
Classification, e.g., Support Vector Machines (SVM), Random Forest (RF), Artificial Neural Networks (ANN)
Feature selection
DataSet Structure
The DataSet object is primarily composed of three
data structures: data, metadata,
and vardata, each of which is a
Pandas.DataFrame object containing an indexed rectangular array of values.
These dataframes are described as follows:
data: The rows of theDataFramerespresent samples, e.g., participants in a clinical study. The columns represent the features, or observations, of each sample e.g., RNA seq expression values, metabolite peak areas for given m/z s and retention times, or shedding scores across multiple virus and bacteria. The rows of the data are labeled via theindexof theDataFrameand the columns are labeled via thecolumnsof theDataFrame.>>> # imports >>> from orthrus.core.dataset import load_dataset >>> # load dataset >>> ds = load_dataset(os.path.join(os.environ['ORTHRUS_PATH'], ... 'test_data/Iris/Data/iris.ds')) >>> # print data >>> ds.data sepal_length sepal_width petal_length petal_width 0 5.1 3.5 1.4 0.2 1 4.9 3.0 1.4 0.2 2 4.7 3.2 1.3 0.2 3 4.6 3.1 1.5 0.2 4 5.0 3.6 1.4 0.2 .. ... ... ... ... 145 6.7 3.0 5.2 2.3 146 6.3 2.5 5.0 1.9 147 6.5 3.0 5.2 2.0 [150 rows x 4 columns]
metadata: The rows of theDataFramerepresent samples. The columns represent decriptive data for each sample, e.g., class label, age, time point, species.>>> # print metadata >>> ds.metadata species 0 setosa 1 setosa 2 setosa 3 setosa 4 setosa .. ... 145 virginica [150 rows x 1 columns]
vardata: The rows of theDataFramerepresent features, or observations. The columns represent descriptive data for each feature, e.g., location on a chromosome of a gene (gene locus), retention time of a measured metabolite, description of a measured bacteria.>>> # load dataset >>> ds = load_dataset(os.path.join(os.environ['ORTHRUS_PATH'], ... 'test_data/GSE73072/Data/GSE73072.ds')) >>> # print vardata (2 columns for example) >>> ds.vardata[['GENE_ID_REF', 'Description']] GENE_ID_REF Description ID_REF 10_at 10.0 N-acetyltransferase 2 (arylamine N-acetyltrans... 100_at 100.0 adenosine deaminase 1000_at 1000.0 cadherin 2, type 1, N-cadherin (neuronal) 10000_at 10000.0 v-akt murine thymoma viral oncogene homolog 3 ... 10001_at 10001.0 mediator complex subunit 6 ... ... AFFX-ThrX-5_at NaN NaN AFFX-ThrX-M_at NaN NaN AFFX-TrpnX-3_at NaN NaN AFFX-TrpnX-5_at NaN NaN AFFX-TrpnX-M_at NaN NaN [12023 rows x 2 columns]
See the Creating a DataSet tutorial for an depth guide to constructing a DataSet instance.
Note: In order to run the code above you must first export your orthrus repository path, e.g., export ORTHRUS_PATH=/path/to/orthrus/, and run the script
generate_dataset.py located in the GSE73072 project directory.
If you are a part of the CSU team and want access to the full GSE73072 DataSet, roughly 20000 genes, download the DataSet object by accessing /data4/kehoe/workspace/datasets/GSE73072.ds
on katrina’s racecar, or download it by accessing this folder on google drive.
Basic Usage
The main goal of the DataSet object is promote modularity and compatibility with other
data science and machine learning packages, e.g., sklearn. For example, if a user wishes to visualize their dataset,
rather than hard code or wrap a specific visualization algorithm into the DataSet class to make it available to them,
they would pass an embedding object, such as PCA, to the
visualize() method which will apply the specific visualization method for the user. The main utility of
the visualization method is to take care of the boiler plate code associated with applying the embedding class, such as generating labels and grabbing the
data matrix, and plot generation. See the example below:
>>> # imports
>>> import os
>>> from orthrus.core.dataset import load_dataset
>>> from sklearn.decomposition import PCA

>>> # load dataset
>>> ds = load_dataset(os.path.join(os.environ['ORTHRUS_PATH'],
...                                'test_data/Iris/Data/iris.ds'))

>>> # define embedding
>>> pca = PCA(n_components=2, whiten=True)

>>> # visualize species of iris with pca
>>> ds.visualize(embedding=pca,
...              attr='species',
...              title='',
...              subtitle='',
...              save=True,
...              save_name='iris_species_pca')
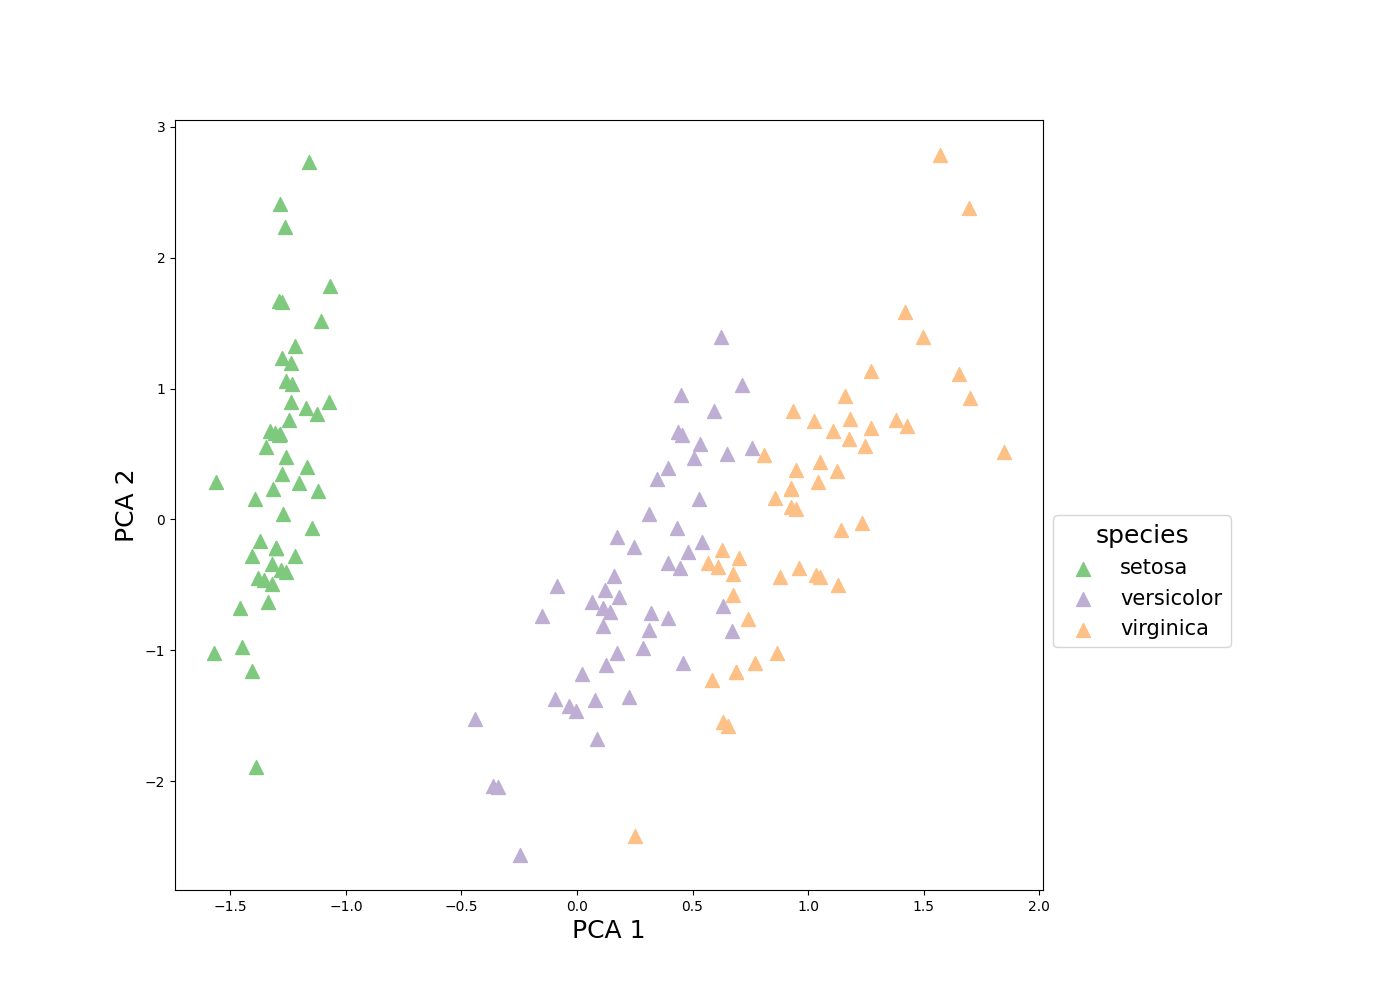
2D PCA embedding of the Iris dataset
Visit the Visualizing Data tutorial for more examples related to data visualization.